Job Cost
Job Cost Highlights in Plexxis Software for Subcontractors
Job Cost
Job costing for subcontractors is like trying to see what a thousand-piece puzzle looks like when you only have 50 pieces, and those 50 pieces keep changing on you. This is a massive contributor to the problem, where jobs look good until they are 80% or 90% complete, but then the wheels fall off the cart. You would think that keeping the Field and office connected would help, but it’s nowhere near enough as Job sites are VUCA (Volatile, Uncertain, Complex, Ambiguous) environments that are constantly in motion. You must have all the pieces, on top of keeping the Field and office connected, which is what Plexxis provides.

The ‘analysis’ tab is where you can see your budget versus actual variance in your quantity analysis. Once you’ve selected the job, you can view the analysis from different perspectives, like “labour w/ subsection views,” “material w/ subsection views,” “by week by expense type,” etc. To see how this information gets into the system, view our job start-up and Pre-Con video.
In this tab, you can also view hours, monthly billing variance, etc. Based on the analysis, if you notice that you have a job that is not doing too well, you can dive deeper and investigate the problem right here.
As Plexxis allows you to integrate all the different departments, you never have to chase anyone down for information. For example, if you noticed an overage in quantities of a specific material, you can drill into the PO and see the actual PO that put you over the budget and who approved it.
We have a live connection between bidding, field and finance. So, without any imports, exports, custom APIs or anything being done, the Field has access to the same information, or as much information as you want them to have. For example, if the foreman on the Field goes to the ‘Jobs’ breakout using the foreman app on his/her iPad and wants to see the live ‘job material breakout’ in quantities, they can do that. All the information that the foreman requires is available, including pending and approved change orders. All this information is immediately available without any emails or reports being sent around.
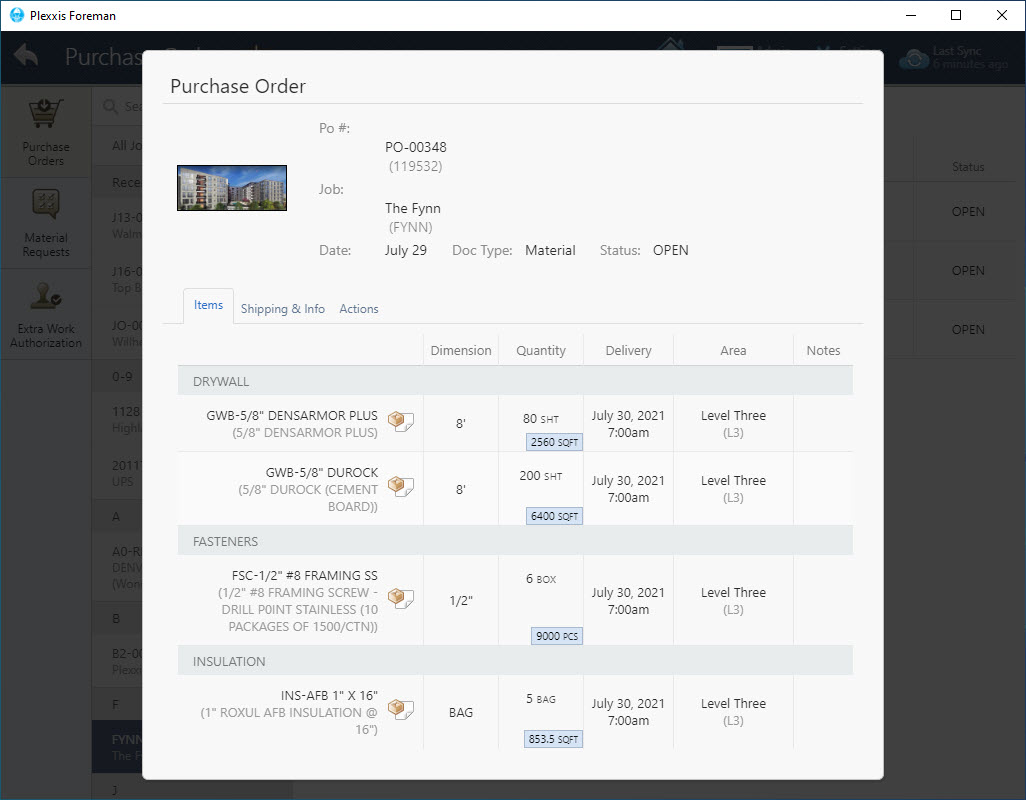
We strip the pricing out of every single document that goes to the Field. For example, if you want the foreman to have the ability to view purchase orders, they will be able to see what materials are coming in but won’t be able to view any pricing info. They can also take actions such as taking a picture of the packing slips, making notes of anything that is damaged or didn’t show up, and making sure that AP has everything they need to go out. When that purchase order is created, the cost hits the job at the time of the purchase order, and you’re not waiting for the invoices to come back and the invoices having to be entered before you get an actual committed cost.
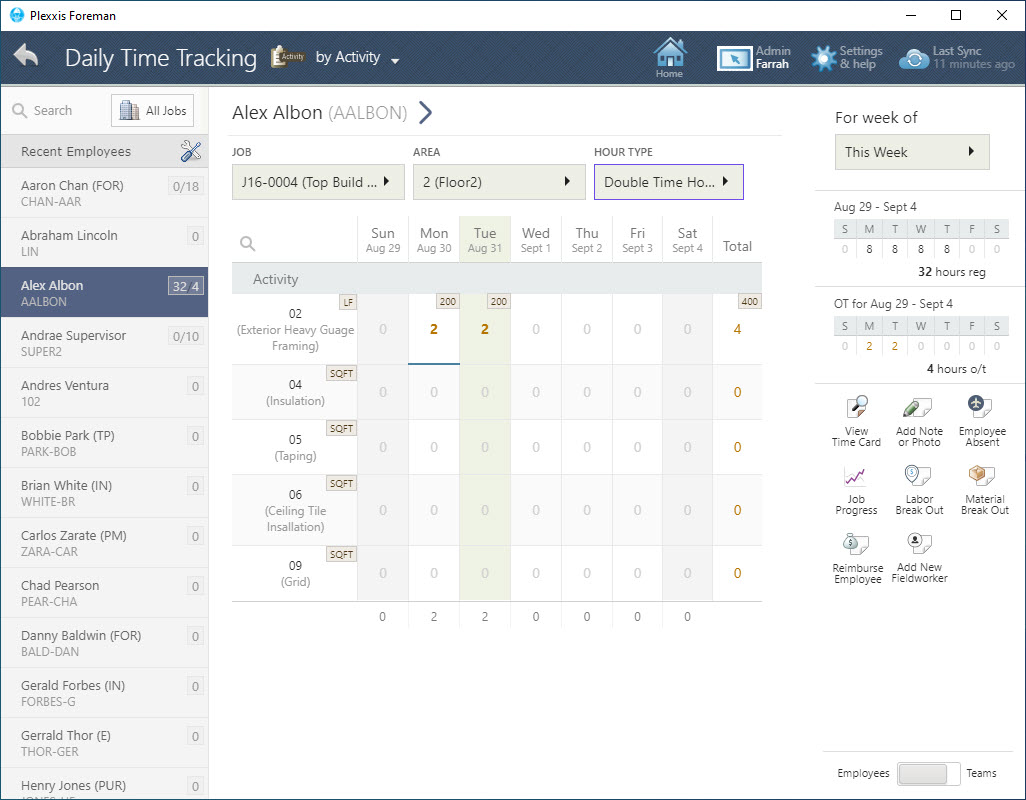
The image above shows you the ‘Daily Time Tracking’ view in the foreman app. If you want to go from a production by employee perspective, select the ‘Employees’ view. This is a single employee timecard, and you can enter costs, time and production that they completed. You can also switch over to ‘Teams’ view and complete timecards and production by a crew. Or you can go into the ‘Job Progress’ and enter in a percent complete or quantity complete. It’s the Field’s choice.
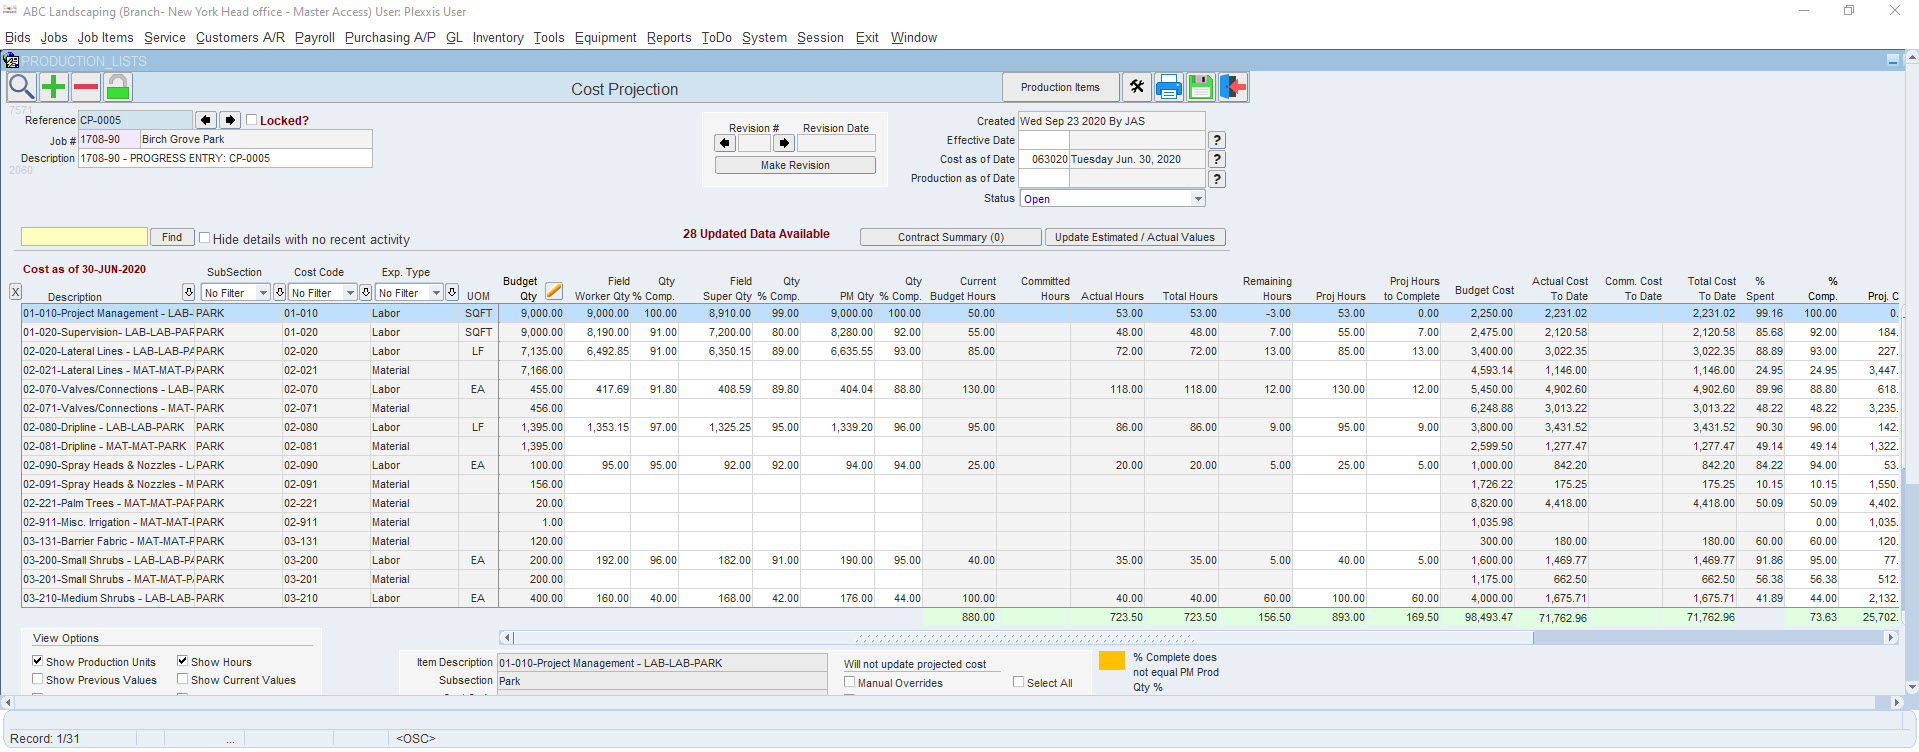
On the ‘Projection’ tab, click on an ‘Open’ cost projection and select the option to “Show Production Units.” You can see the production units or the opinion that has come in from the Field. The Project Managers can override it with their opinion and indicate the reasons why. This will automatically feed the live WIP analysis, which you will see in our financial management video.
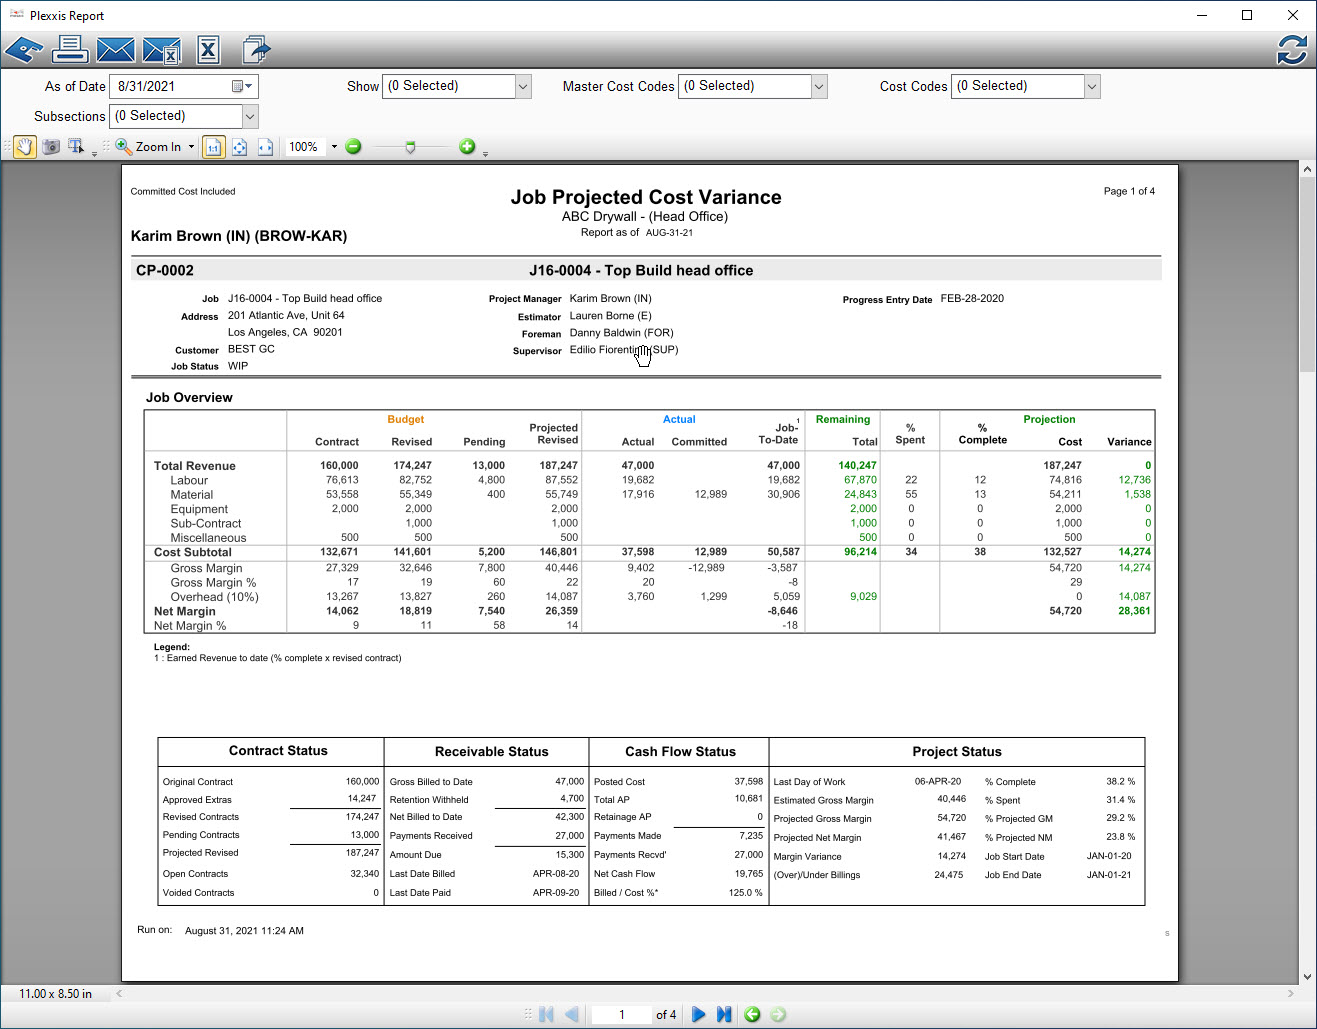
At Plexxis, we’re not necessarily changing anything about what you do. We’re just making everything easier, live, and at your fingertips. For example, look at the Projection Cost Variance report (as shown in the image above). To print the PCV report, go to the ‘Main’ tab and click the ‘Projection Cost Variance’ button at the bottom of your screen. In this report, you can view your budget versus your actual with remaining and projection along with other high-level status reports. You can also view the last ten projections so you can see how the projections are trending. This information is live, and you can automatically set this on the scheduled reports. This way, it hits your full distribution list at any time or frequency that you set.
LIVE Labor and Material Visibility
Here is an example of what live feedback between Bidding, Field, and Finance looks like.
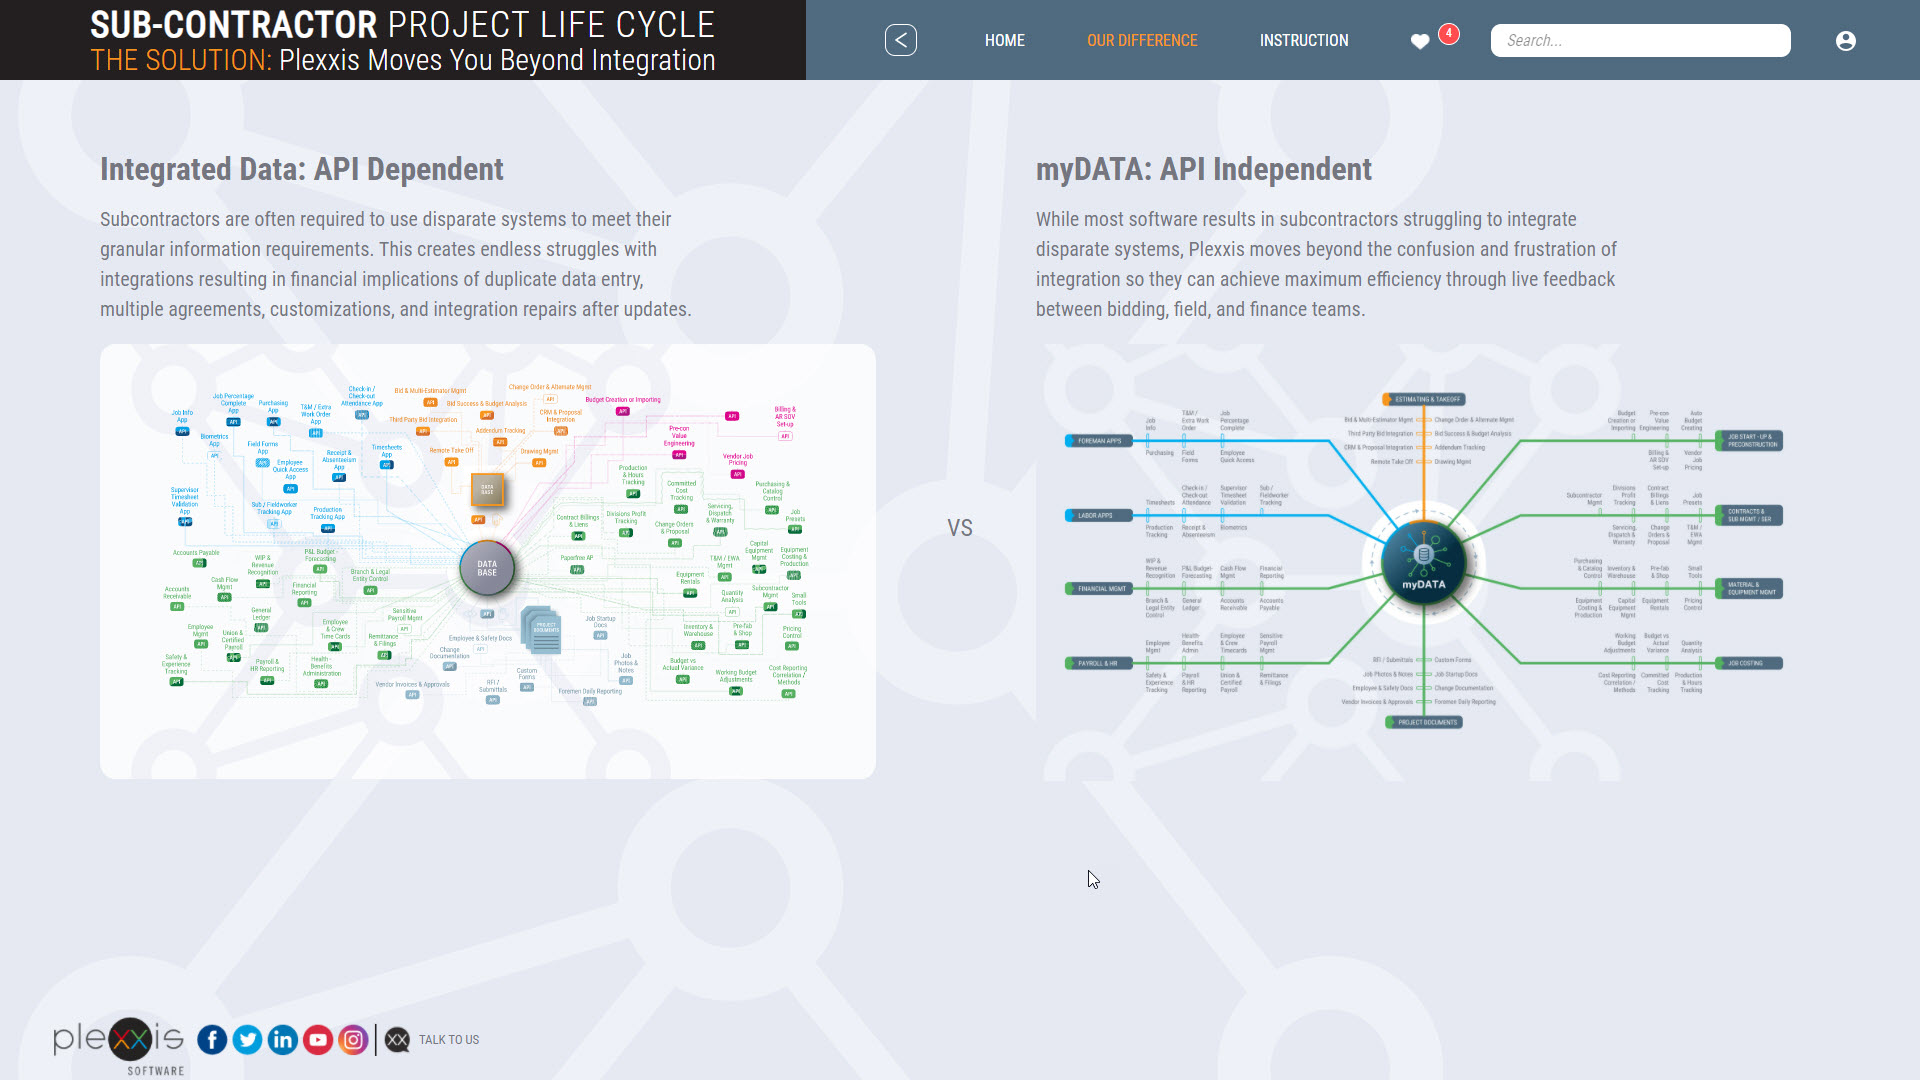
The image on the left shows how nicely Plexxis unites all the core workflows that subcontractors use daily. It feels like a first-class direct flight, especially when you compare it to the image on the right, which happens when subcontractors use software made for GCs. All too often, this software has been improperly relabeled as subcontractor software, and it feels like a flight with ten connections. You still get to the same destination, but the trip sucks. You’ve had no time to rest, no time to eat properly and you and your colleagues are in a bad mood.

Our system is multi-trade, multi-company, multi-branch and multi-division. On the mobile application, you’ll notice that all apps are in one spot. You do not need six to ten apps to complete all your functions. Our app is a super app.
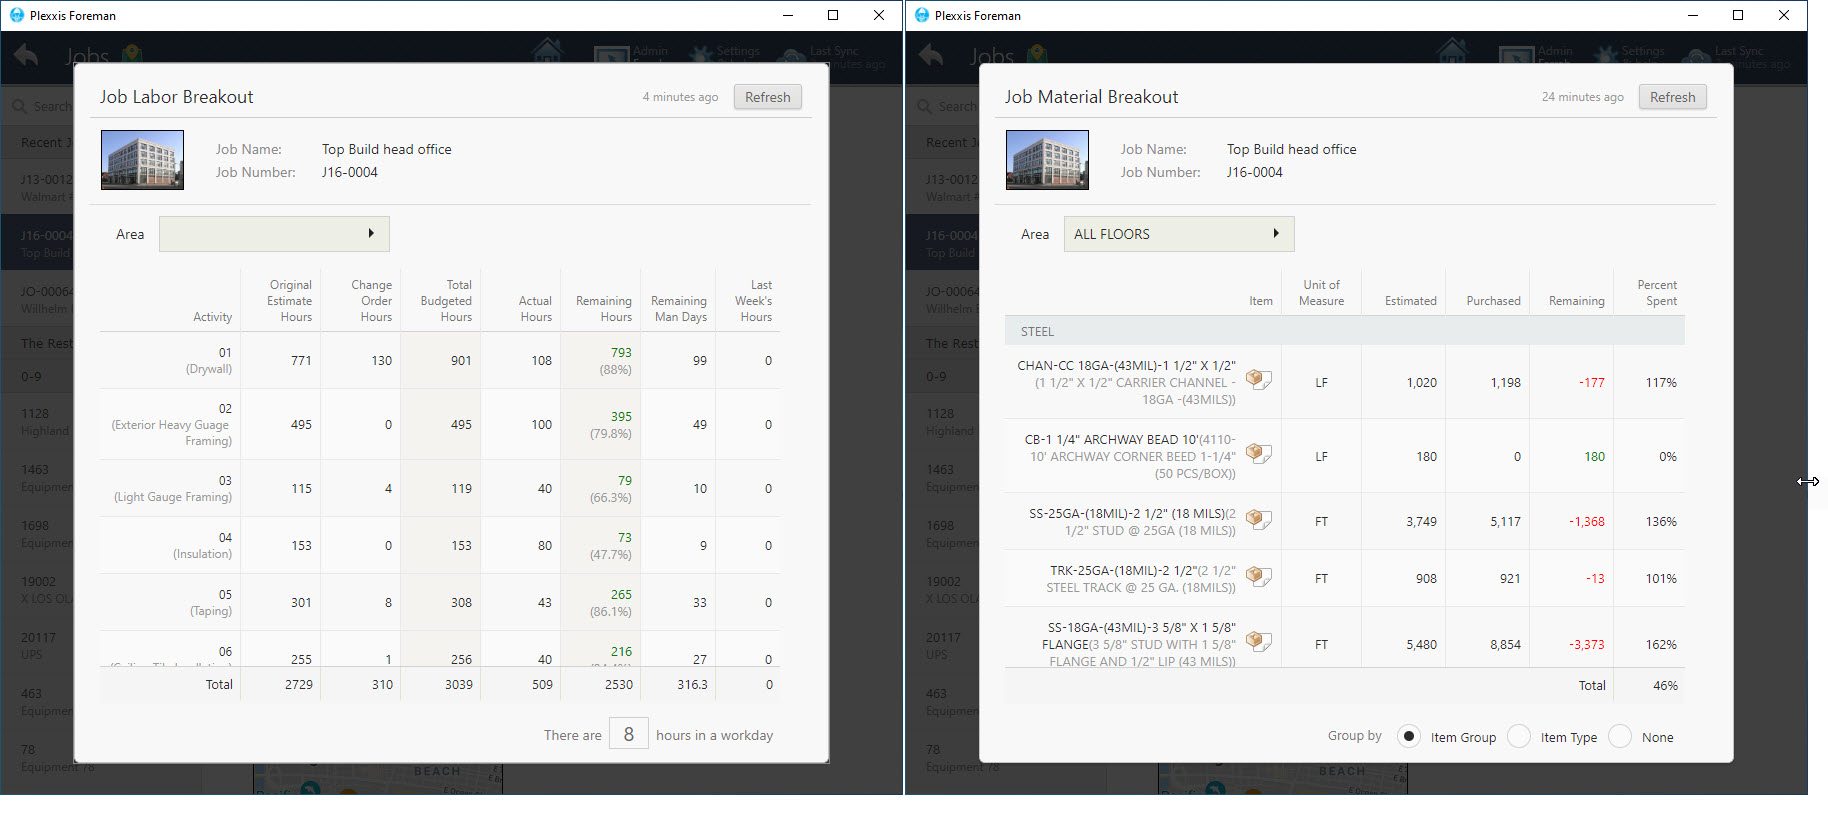
If you click on ‘Jobs,’ you can look at the labour breakout (image on the left) and material breakout (image on the right). You get a live labour breakout with remaining hours and remaining man-days, including pending and approved change orders. When you go over to the material breakouts, you get remaining and percent spent by item, or if you want, by floor.
Job Cost
Share:
New From Plexxis

The Rise of Construction Safety Tech
The Rising Cost of Construction
Data Privacy Acts: A Guide for the Construction Industry